Alignment of a SLM-based STED depletion beam
For citeable PDF versions of this document, please use the links below.
- DOI (concept): https://doi.org/10.5281/zenodo.3567747
- DOI (version): https://doi.org/10.5281/zenodo.3567748
- Authors: Aurélien Barbotin
- Licence: CC BY-NC-SA 4.0 (Attribution-NonCommercial-ShareAlike)
- Last modified: 5 yrs ago
The listed authors have participated in the writing of this document. As the content is the culmination of long term work in the Dynamic Optics and Photonics Group, many others have contributed directly or indirectly to this material. We consciously acknowledge all of these contributions, even though it is impractical to list them all here
Abstract
This tutorial explains the specifics of how to set up and align the depletion beam of a STED microscope that includes a spatial light modulator (SLM). This can be done by following these steps:
Outline
-
Create an off-axis hologram
-
Position the SLM phase mask
-
Calibrate the SLM modulation amplitude
-
Remove aberrations
-
Ensure coalignment of the SLM pupil and the objective back aperture
Setup
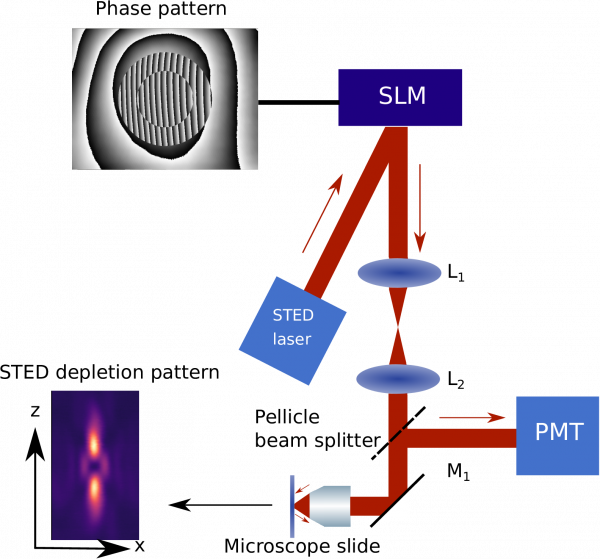
On top of the normal components of a STED microscope, the setup should include a phase SLM, located in a plane conjugate to the back focal plane of the objective.
Direct visualisation of the STED laser beam profile makes the whole alignment process a lot easier. It is possible to do so by scanning a gold bead through the focus and collecting the scattered light on a point detector like a photomultiplier tube (PMT) using a pellicle beam splitter (see Fig. 1).
Creation of an off-axis hologram
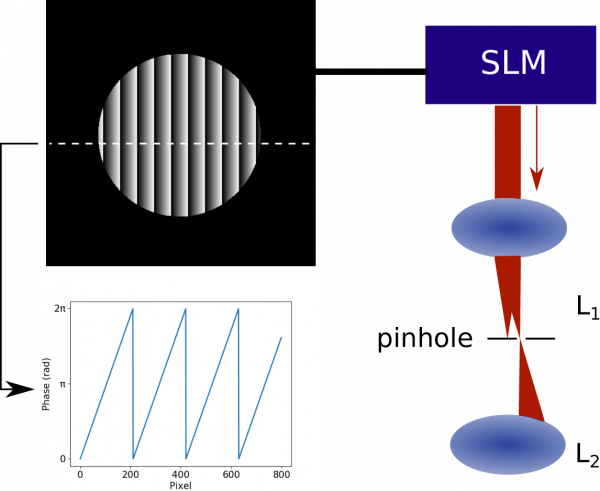
Even though SLMs can have a high modulation efficiency, there is always a portion of light that does not get modulated. In the case of a STED depletion beam, where the aim is to create a ring-shaped focus with a central intensity as low as possible, any unmodulated light would fill up the central intensity minimum and drastically reduce the performance of the microscope. This issue can be addressed by spatially separating the modulated from the unmodulated light: this is achieved by using a blazed grating, which is added to the phase pattern to shift the hologram output in the Fourier (focal) plane. Remaining unmodulated light can be filtered out in an intermediate plane using a pinhole (see Fig 2).
Position the SLM phase mask
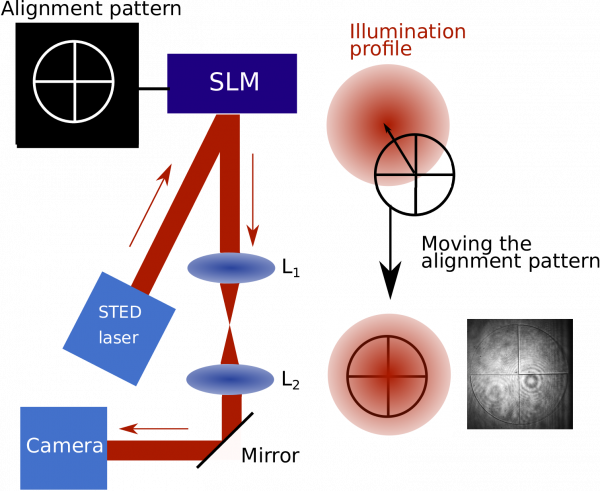
For optimal performance, it is important that the centre of the phase mask displayed on the SLM coincides with the centre of the STED laser profile. To do so, you can display an alignment pattern on the SLM and image it with a camera slotted in one of the intermediate planes of the depletion path. An alignment pattern can be introduced by the SLM. Where this pattern exhibits a step in phase between adjacent pixels, a dimmer line will appear on the camera due to light lost by diffraction at the phase step. This process is explained in more detail in the general SLM alignment document . This pattern can be adjusted on the SLM to move to the centre of the STED laser profile (see Fig 3).
Calibrate the SLM modulation amplitude
The phase on a SLM can be controlled pixel-by-pixel, with a user-defined input that is usually a digital signal varying between 0 and 255.
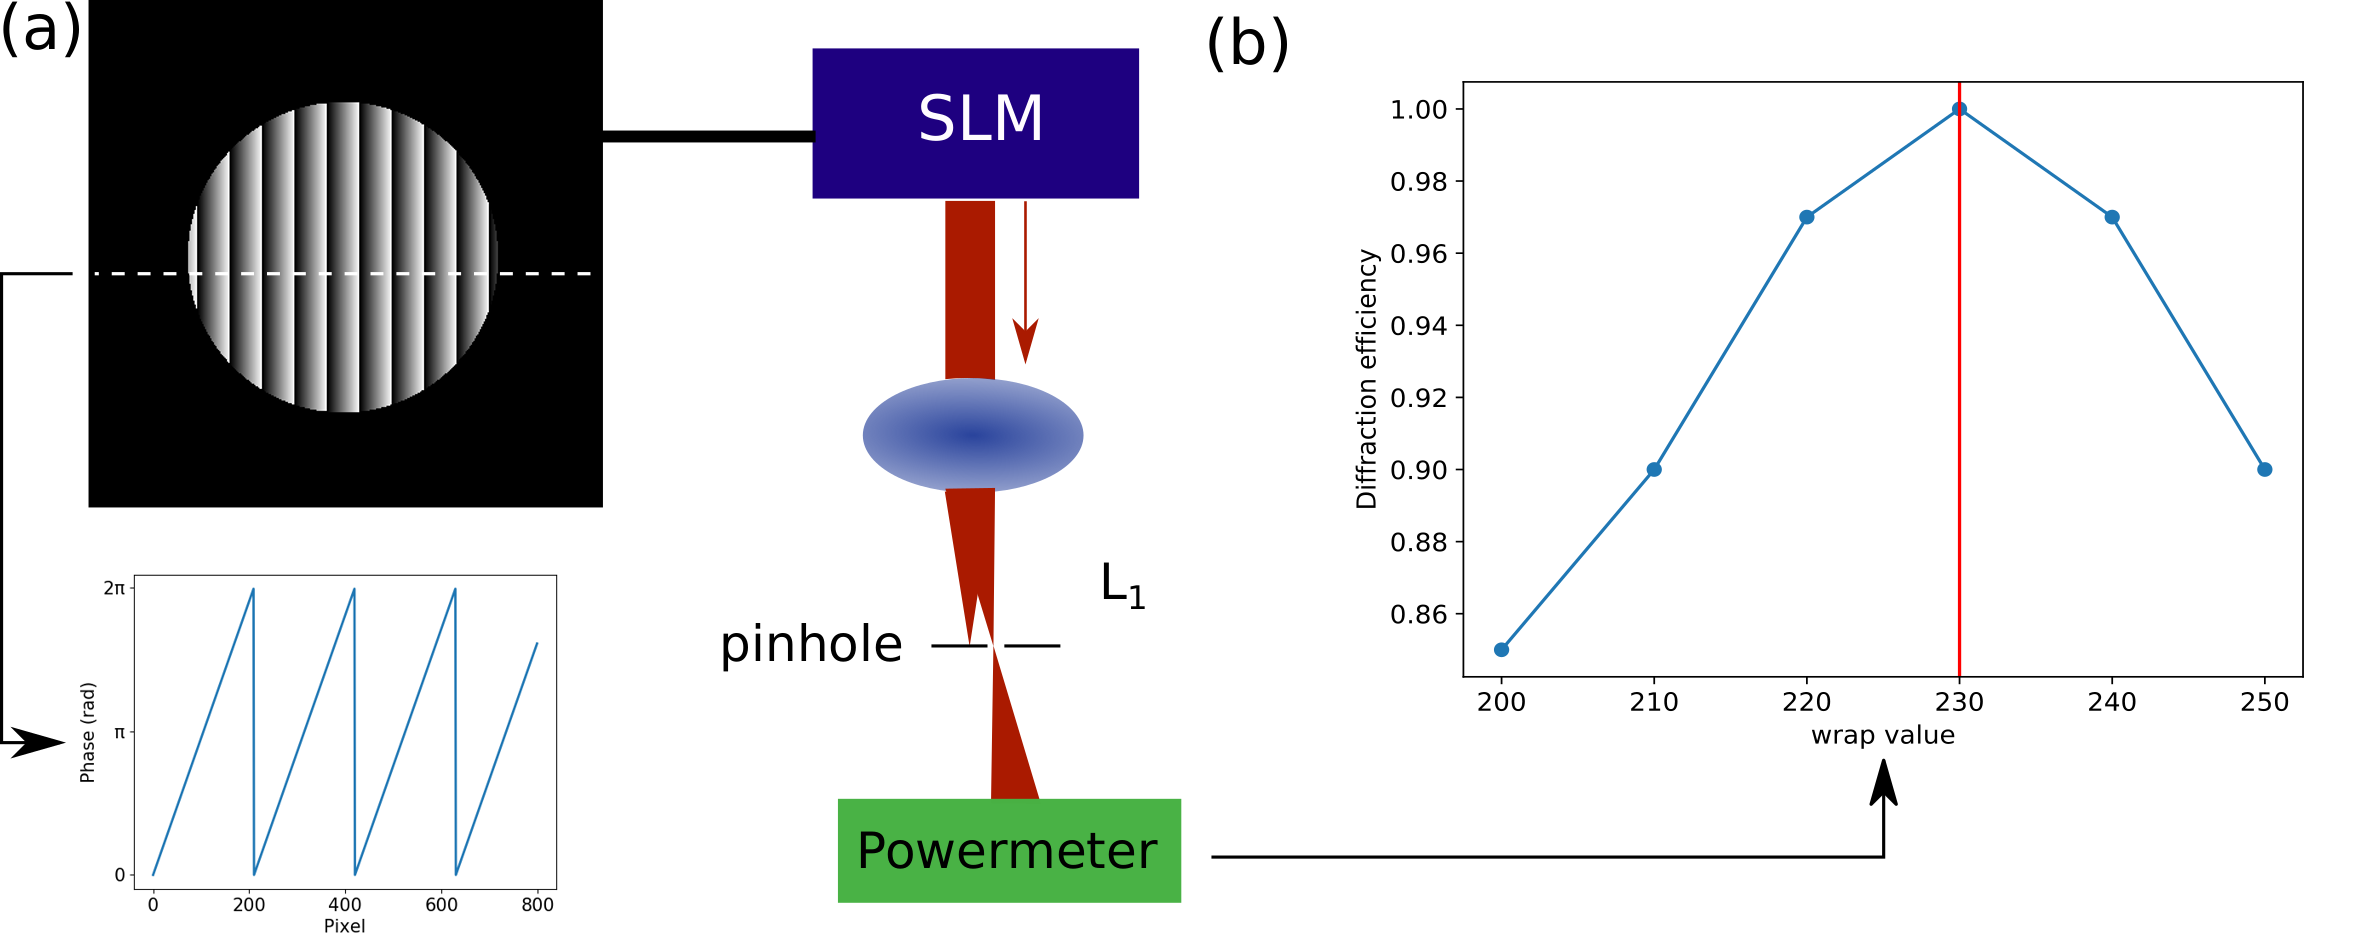
The relation between input signal and phase modulation is calibrated by the manufacturer to be linear. The input value corresponding to a phase modulation of 2\(\rm \pi\) radians (the wrap value) is wavelength-dependent, and is also provided by the manufacturer. The wrap value provided by manufacturers is unfortunately not necessarily accurate, and it is sometimes necessary to recalibrate it. To do so, a convenient method consists in displaying a grating on the SLM and measuring the diffraction efficiency, which is maximum when the wrap value is correct. In practice, this can be done by displaying for instance a blazed grating and blocking the 0-order with a pinhole, as described in section 1. The intensity of the first order can then be measured with a power meter placed anywhere after the pinhole (Fig. 4).
Correction of system aberrations
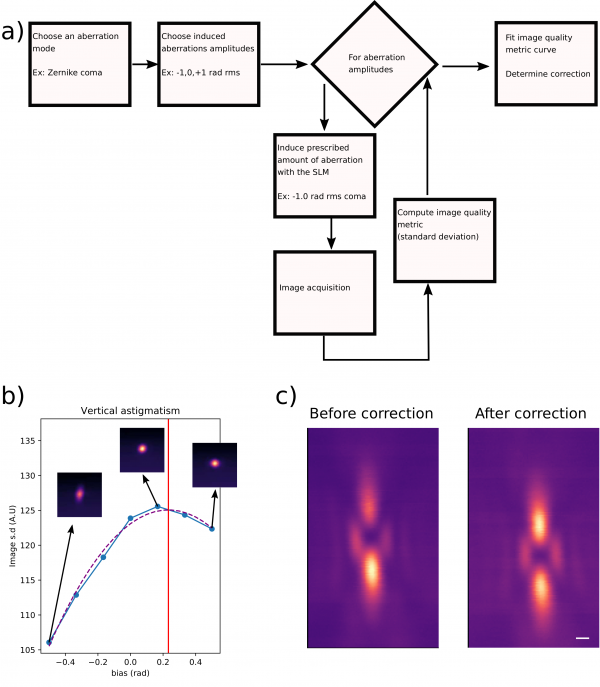
Once the phase pattern is correctly positioned on the SLM, you can correct system aberrations. In most systems, the components in the optical path are not perfect and some aberrations are present. It is possible to compensate them using the SLM. One way of doing this is to use sensorless adaptive optics through imaging a sample of gold beads that scatter the light of the depletion beam. Such imaging allows you to observe the shape of the focus and to assess how aberrations introduced by the SLM affect the focus shape. Adjustment and correction of the aberrations by eye is extremely difficult, so it is more productive to use a sensorless AO scheme, in which aberration modes (typically Zernike polynomial modes) are individually adjusted using an image based correction scheme in which an image quality metric is optimised. The choice of image quality is a key parameter in sensorless adaptive optics. Qualitatively, optical aberrations reduce the focus quality, which in turns decreases image sharpness. In presence of aberrations, the point spread function (PSF) is enlarged, which in images results in the signal being spread across a higher number of pixels with a lower brightness than in non-aberrated images. This results in an intensity distribution that is smoother in aberrated images than in unaberrated images, which can be easily quantified by the image standard deviation, defined as follows:
\[ \operatorname{std}=\frac{1}{m n} \sum_{i=1}^{n} \sum_{i=1}^{m}(x(i, j)-\langle x\rangle)^{2} \]
where \(x(i,j)\) are the pixel values of an \(m\) by \(n\) array of pixels and \(\langle \text{ } \rangle\) refers to the averaging operator.
The AO workflow is summarised in Figure 3a). We found that imaging the STED laser focus without any phase mask (helicoidal or top-hat) was working better for sensorless AO, as aberrations on the ring-shaped foci used in STED have complex effects that can affect image quality in various ways.
Ensure that SLM pupil and illumination profiles are coaligned
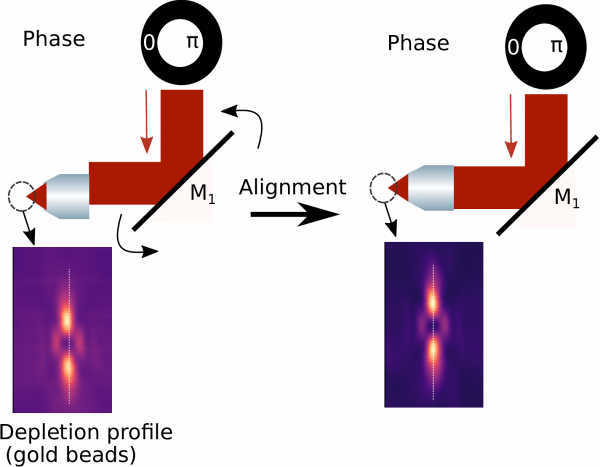
Misalignment between the STED laser and the back aperture of the objective can lead to distortion of the focus. In many microscopes, it is sufficient to remove the objective lens and replace it with a system of two pinholes to ensure that the incident laser beam is centered and straight (and adjust it if not). This approach may however not be precise enough to align the depletion pattern of a STED microscope. In the case of the 2D STED depletion pattern, distortions caused by a misalignment between the STED laser and the back aperture of the objective are very similar to those induced by coma aberration [1]. On the contrary, such misalignments have a very specific effect on the 3D STED depletion pattern: they induce a tilt of the axis through the centroids of the upper and lower lobes. Precise alignment of the STED laser into the back aperture of the objective can thus be achieved by ensuring that the upper and lower lobes of the 3D STED depletion pattern are aligned along the optical axis (see Fig 2d).
References
[1] Brian R Patton, Daniel Burke, Robert Vrees, and Martin J Booth. Is phase- mask alignment aberrating your STED microscope? Methods and Applica- tions in Fluorescence, 3(2):024002, March 2015.
Return to documents
